Home > The ATTC/NIATx Service Improvement Blog > Flowcharting Your Breakfast: How to Find the Right Altitude
The NIATx change model focuses on a sequence of four primary tools:
After a walk-through, teams sometimes struggle to create a flowchart to map out the process they just examined. Whether you use a big sheet of paper and a marker, sticky notes on a dry-erase board, or any number of softwares, here are a few tips to help you develop a useful flowchart.
Navigating the altitude challenge
The flowcharting process usually struggles in two very different ways. We like to think of this as the altitude challenge:
A high-altitude flowchart is like looking at a process from high in the sky. It includes very few details and may not be helpful when looking for elements that can be improved. It lacks specific information about process elements that could be changed. It’s like trying to plan a drive through a neighborhood by looking at a map that only shows the highways.
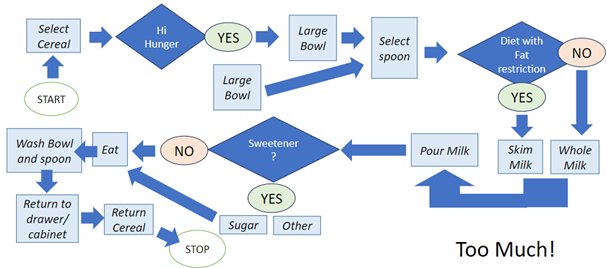
A low-altitude flowchart is like looking at the same process from very close to the ground. This chart will likely include many boxes and arrows and is often too complex to be helpful. It takes too long to decipher all of the details that are not relevant to the key elements that might be a target for improvement. This is like looking at a map that includes every street address when trying to drive across the state.
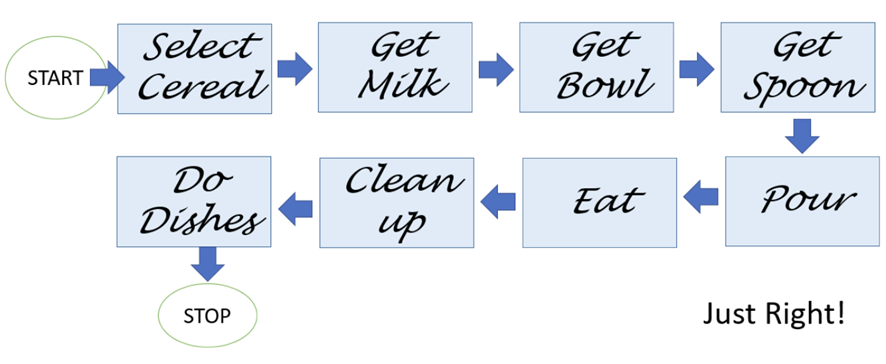
A “just right" altitude flow chart includes all the essential process details and serves as a clear map that can guide the team.
Flowchart your breakfast
Imagine that you were trying to describe the process of making your breakfast with a flowchart.
A “high-altitude” breakfast flowchart might look something like this:

This simple flowchart lacks sufficient detail to explain the steps you followed to make your breakfast.
A “low-altitude” breakfast flow chart might include details like opening the drawer, looking at the spoons, selecting a spoon, picking up the spoon, placing the spoon on the counter, opening the cabinet, selecting a bowl, removing the bowl, placing the bowl on the counter, etc. These extraneous details will distract us from the key elements that might be a focus of improvement.

A “just right” breakfast flowchart might look like something like the flowchart below:

This flowchart could help us to think about some specific areas for improvement. Should we change the fat content of our milk? Should we do another chart for the process of doing the dishes to think about how to make it quicker? And what about that cereal selection? (Maybe Crunchy Fruity Purple Pebbles are not the best choice?) 😊
Good luck improving your breakfast, or any other process, by finding the right altitude that gives you a clear view of potential improvements.
Bonus tips:
The flowchart is a powerful tool for bringing clarity and structure to your change project. It provides a clear visual guide, helping you see the big picture and pinpoint specific areas for improvement. By mapping out your processes, you can identify inefficiencies and make informed decisions to guide your project. Plus, flowcharts foster better communication and collaboration among team members. So, give it a try! You might be surprised at the positive impact it can have on your project.
Learn more about how to flowchart at an upcoming NIATx Change Leader Academy!
NIATx Virtual Change Leader Academy
May 14–June 4, 2024, 2:30–4:00pm CT

Mat Roosa, LCSW-R
Mat Roosa is a founding member of NIATx and has been a NIATx coach for a wide range of projects. He works as a consultant and trainer in the areas of process improvement, evidence-based practices implementation, and organizational development and planning. Mat’s experience also includes direct clinical practice in mental health and substance use services, teaching at the undergraduate and graduate levels, and human services agency administration.
The opinions expressed herein are the views of the authors and do not reflect the official position of the Department of Health and Human Services (DHHS), SAMHSA, CSAT or the ATTC Network. No official support or endorsement of DHHS, SAMHSA, or CSAT for the opinions of authors presented in this e-publication is intended or should be inferred.